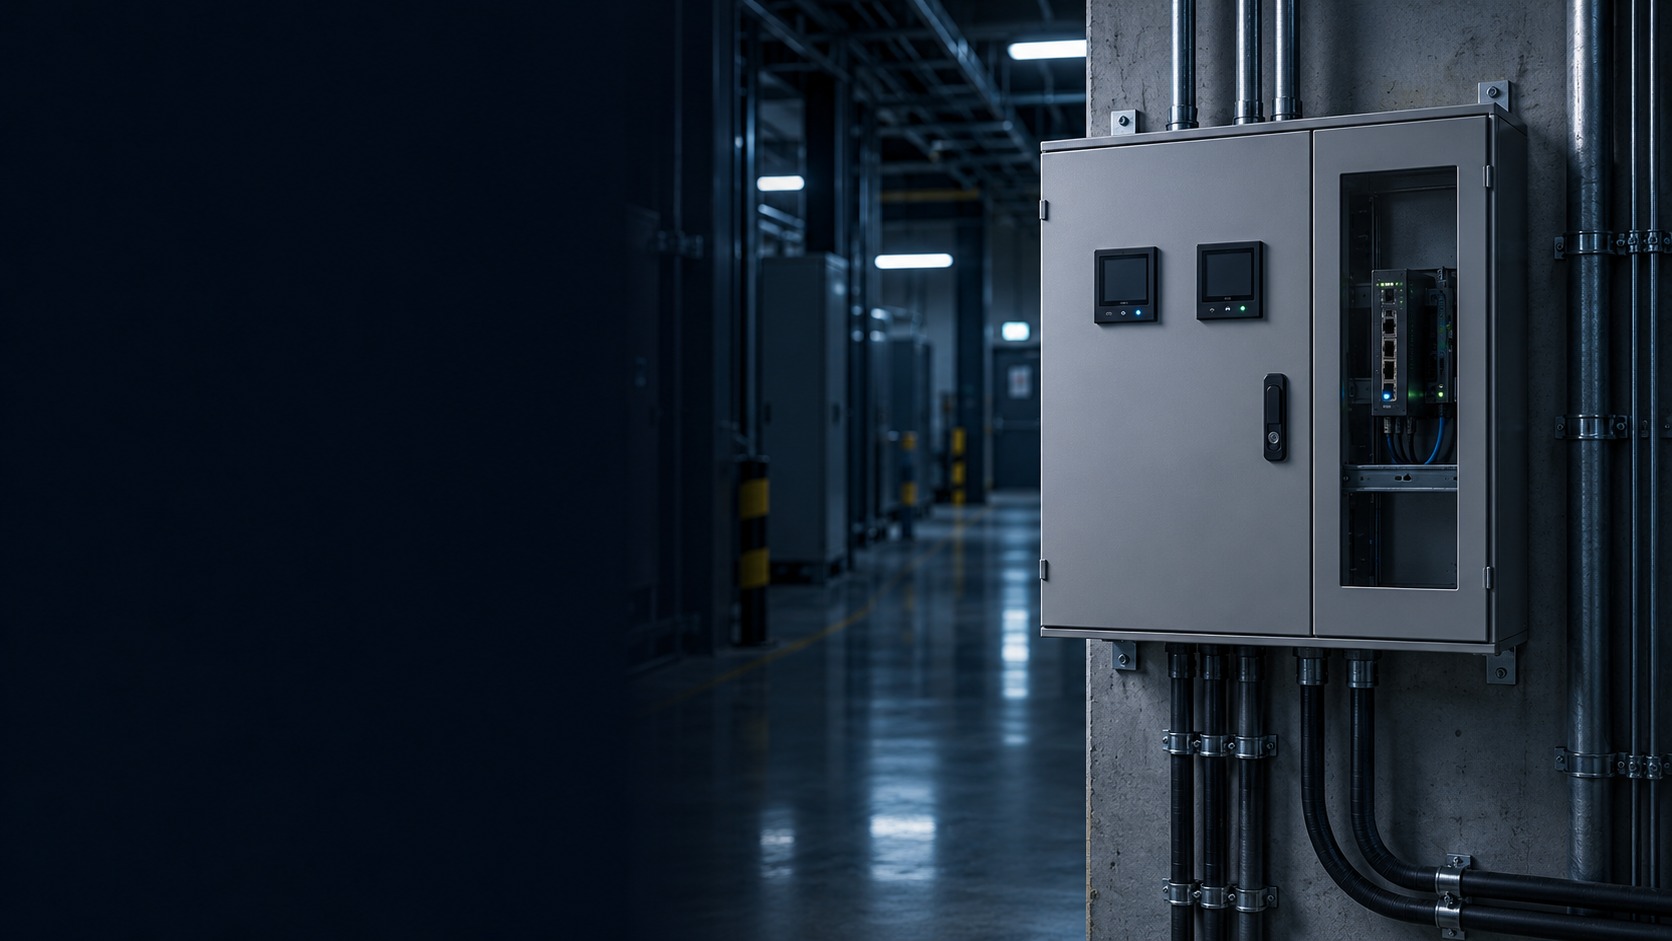
Closed electrical metering cabinet with power meters and monitoring gateway (illustration)

Power Quality & Demand Monitoring in Kuching & Sarawak

Compare supported power-quality values and interval-based demand over time. The selected meter must provide the required measurements; demand monitoring, waveform capture and automatic load control are distinct capabilities.

System selection and integration guideSmart Energy
EnergyPower Quality & Demand Monitoring
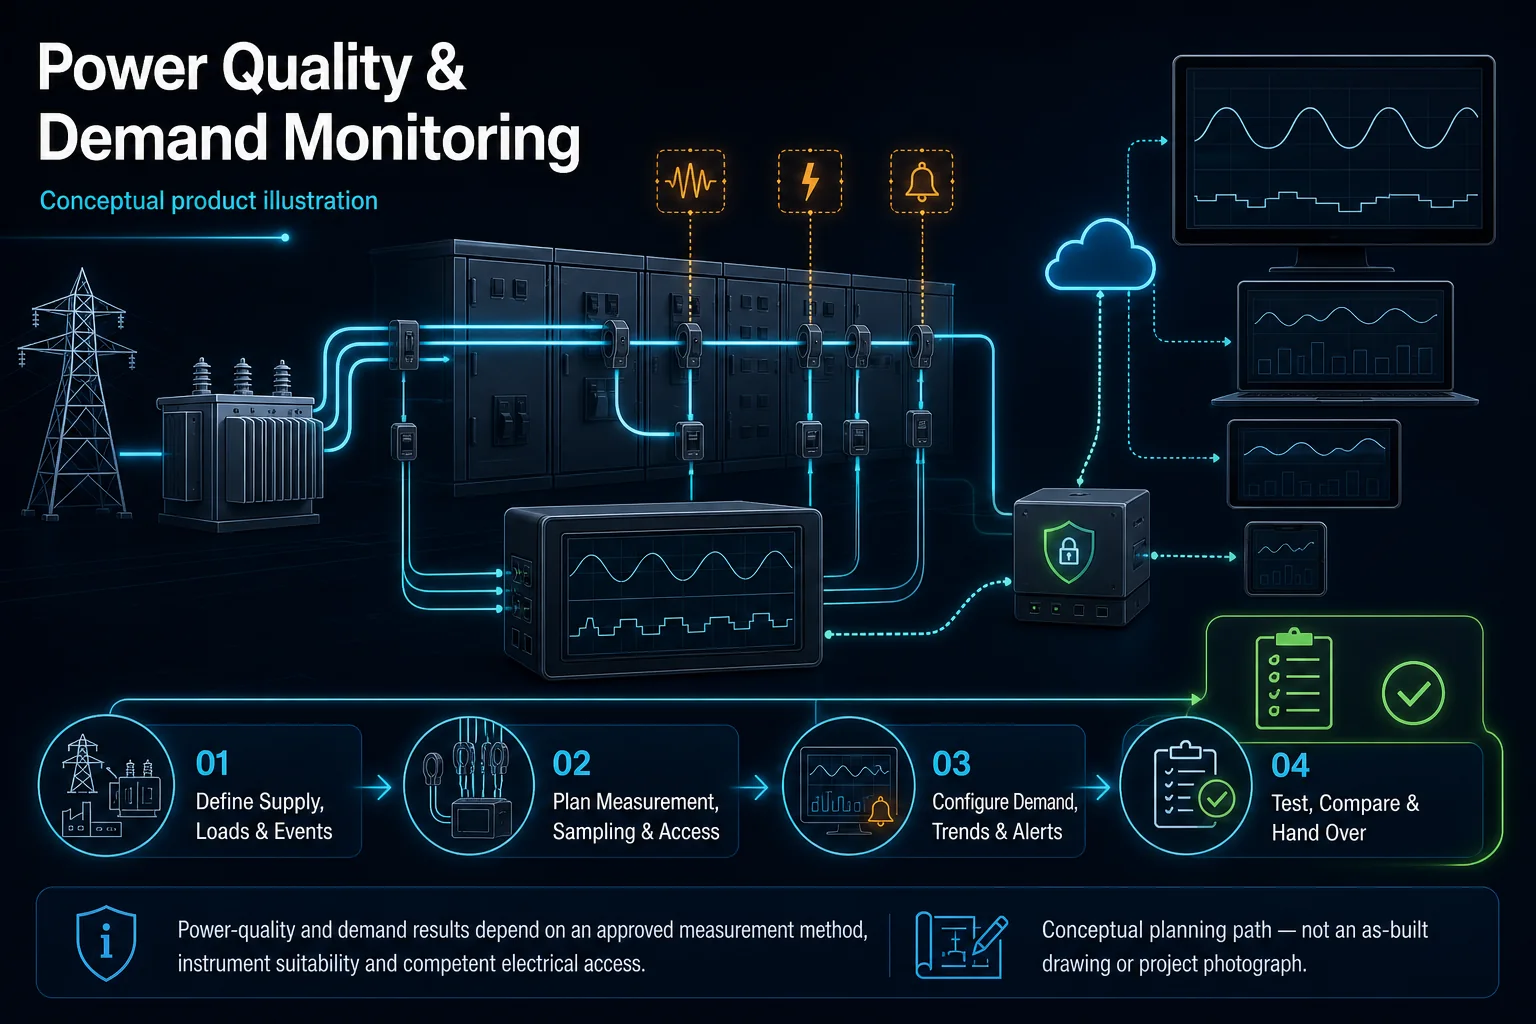
Power Quality and Demand Monitoring system diagram
  1. 01Power Quality & Demand Monitoring
  2. 02Sensor placement, thresholds and alerts
  3. 03Field interface
  4. 04meter comparison and CT direction
Conceptual Power Quality & Demand Monitoring product and system illustration.
Illustration & scope boundary

Conceptual Power Quality & Demand Monitoring product and system illustration for Energy. Final device form, model, interfaces and quantities are confirmed from the assessed scope and approved product data. Conceptual measure, alert and respond loop for Power Quality & Demand Monitoring, derived from this page's scope, interfaces and acceptance record.

Conceptual planning path — not an as-built drawing or project photograph.

What Power Quality & Demand Monitoring covers

Compare supported power-quality values and interval-based demand over time. The selected meter must provide the required measurements; demand monitoring, waveform capture and automatic load control are distinct capabilities.

It sits in Smart Energy under Energy. The final deliverable is shaped by the intended outcome, the installed or proposed environment and the interfaces that must be owned, supplied, integrated and tested.

When to use this page

Compare supported power-quality values and interval-based demand over time. The selected meter must provide the required measurements; demand monitoring, waveform capture and automatic load control are distinct capabilities. Specify required values such as voltage, current, power factor or harmonics, and whether event or waveform recording is needed. Confirm the meter feature set, demand averaging interval and thresholds rather than assuming every energy meter provides them.

Typical environments to assess

  • Commercial electrical metering
  • Factories and agreed circuit monitoring
  • Tenant and shared-load dashboards
  • Compatible meter-to-BMS integrations

Engineering SOP & Handover Checklist

From the initial brief to the handover record: what to prepare, check and confirm with HJ.

01

Operational Purpose & Workflow

Define Energy as the operating result for Power Quality & Demand Monitoring, including the users, process and exceptions it must serve.

Compare supported power-quality values and interval-based demand over time. The selected meter must provide the required measurements; demand monitoring, waveform capture and automatic load control are distinct capabilities.

02

Pre-Attendance Evidence

For Power Quality & Demand Monitoring, confirm metering objective and circuits, CT or meter class and ratio, sampling, tariff, dashboard, BMS and billing boundary.

Specify required values such as voltage, current, power factor or harmonics, and whether event or waveform recording is needed. Confirm the meter feature set, demand averaging interval and thresholds rather than assuming every energy meter provides them.

03

Diagnostic & Testing Path

Map Sensor, meter or command → Control & integration logic → Field interface → Dashboard, trend & handover for Power Quality & Demand Monitoring and identify every interface owned by HJ, the customer, ISD supply or an appointed specialist.

04

System & Responsibility Boundary

Monitoring supports analysis but is not revenue billing unless approved metering and governance are specified; CT installation and isolation are electrical works. Final models, capacities and quantities still follow survey, compatibility and availability.

Demand is averaged over a configured interval, not the same as instantaneous power. Harmonics, disturbance capture and waveform recording depend on the meter feature set; monitoring does not automatically correct power quality or control loads.

05

Acceptance & Handover Record

For Power Quality & Demand Monitoring, record meter comparison and CT direction, demand or threshold event, trend, export and circuit mapping; also agree point-to-point function test, scene, schedule, trend or alarm test, backup, export and operator handover before handover.

Compare agreed meter and dashboard points for units, scaling, circuit identity and timestamps. Check trends, communication-loss indication and any configured alerts; record assumptions and ownership without changing protective settings.

Engineering Scope, Regulatory & Service Boundaries

Responsibility and evidence boundary

HJ coordinates assessment, engineering, installation, integration, testing and lifecycle support only for the scope recorded in the quotation. ISD handles catalogue, model, datasheet, supply and availability enquiries. Customer, consultant, builder and appointed-specialist responsibilities remain explicit.

Final scope, quantities, compatibility, access, programme, availability and responsibility are confirmed during assessment and quotation.

This focused topic remains connected to its complete system owner. Final models, quantities, interfaces and included work are confirmed in the assessed quotation.

Questions before proceeding

Use the answers as a planning boundary; site conditions and written scope remain decisive.

What should be confirmed for Power Quality & Demand Monitoring?

Specify required values such as voltage, current, power factor or harmonics, and whether event or waveform recording is needed. Confirm the meter feature set, demand averaging interval and thresholds rather than assuming every energy meter provides them.

What are the limits of this scope?

Demand is averaged over a configured interval, not the same as instantaneous power. Harmonics, disturbance capture and waveform recording depend on the meter feature set; monitoring does not automatically correct power quality or control loads.

What should be checked before handover?

Compare agreed meter and dashboard points for units, scaling, circuit identity and timestamps. Check trends, communication-loss indication and any configured alerts; record assumptions and ownership without changing protective settings.

Planning Power Quality & Demand Monitoring? Tell HJ about your site

Tell us where it will be used, what it needs to do and what equipment you already have. HJ will recommend the right system, explain who is responsible for what, and agree the next step with you.